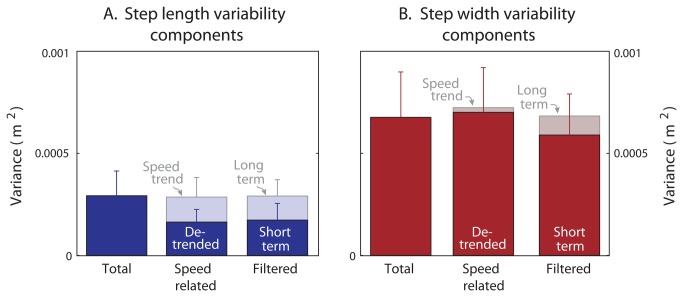
Figure 4. Overall variance of step length and step width.
(A) Step length and (B) step width are each decomposed by de-trending and by filtering (N = 14). In each panel, the average total variability (labeled “Total” at left, with error bars for standard deviation across subjects) is contrasted with the variability of the components determined by the “Speed-related” trend and the “Filtered” components (middle and right of each panel). The speed-related trend and the de-trended step lengths (lighter and darker bars respectively) have similar variances whose sum is nearly equal to total variance. The long- and short-term components (lighter and darker bars respectively) of step length, separated by filtering, yield variances comparable to the speed-related components. In contrast, step width exhibits little speed-related trend, and little low-frequency content. The speed-related trend accounted for about half of the total variance in step length, but a negligible amount of width. De-trended step width variability was over 4 times the de-trended step length variability (P = 4.2 · 10−8).

