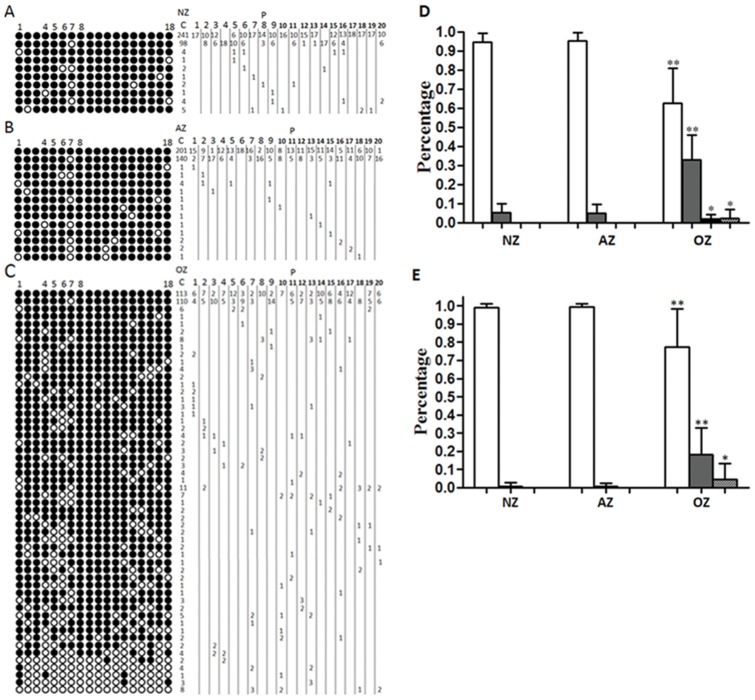
Figure 1. Methylation patterns of H19 (18 CpGs) in human sperm.
A. Methylation patterns of H19 in normozoospermia. B. Methylation patterns of H19 in asthenozoospermia. C. Methylation patterns of H19 in oligozoospermia. D. Percentages of clones with four different methylation categories of H19-DMR. E. Percentages of clones with three different methylation categories of CTCF-binding site 6. NZ, normozoospermia; AZ, asthenozoospermia; OZ, oligozoospermia; C, number of clones; P, patient codes with number of clones per methylation patterns. CpGs: methylated shown in black, unmethylated shown in white. CpGs 4–8 = CTCF-binding site 6. White bars: complete methylation; grey bars: mild hypomethylation; black bars: severe hypomethylation; dotted bars: complete unmethylation. Data are means+SD (n = 20 patients from each group). Statistically significant differences from the control group (NZ) are represented with asterisks: *P<0.05, **P<0.01.

