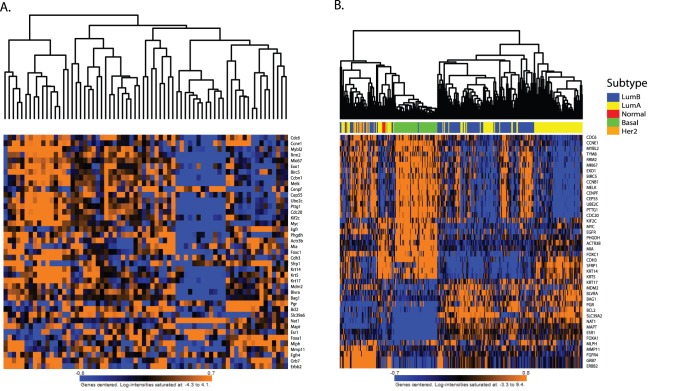
Figure 1. PAM50 clustering.
A) NZB cross samples after unsupervised hierarchical clustered using the mouse orthologs of the PAM50 signature. B) The human breast cancer U133A gene expression data set after PAM50 subtype clustering using the Genefu R subtyping algorithm. Subtype classifications are indicated along the top of the heatmap.

