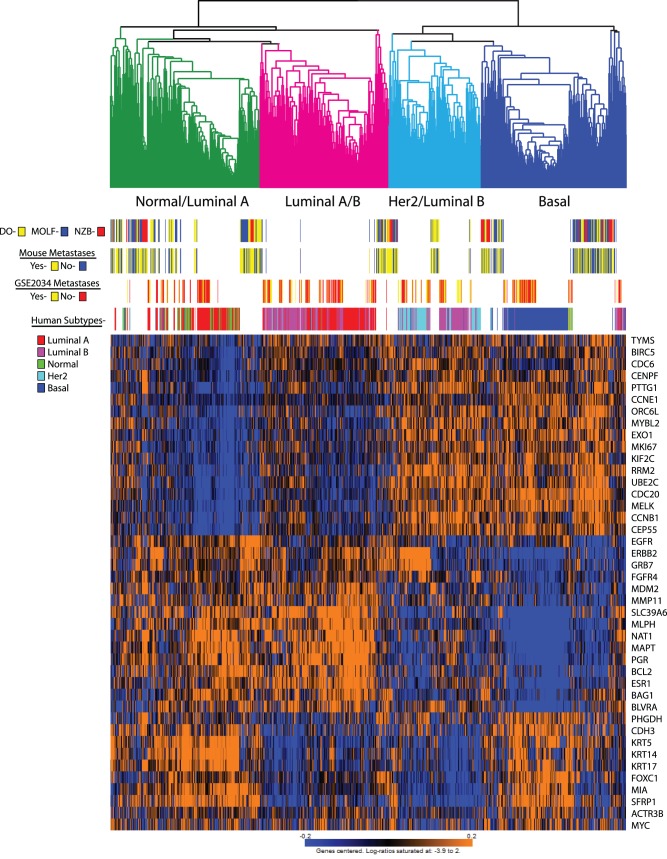
Figure 2. Unsupervised clustering of the GSE2034, TCGA, MOLF, DO and NZB PAM50 genes.
The position of the mouse samples and the subtypes of the human samples are indicated across the top of the heatmap. The color coding of the clustering across the top of the figure is based on the enrichment of human samples within each major block.

