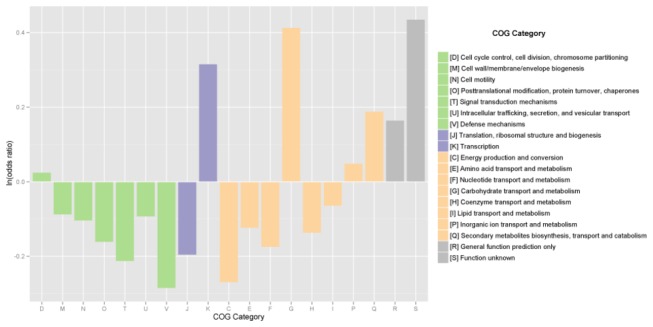
Figure 5. Odds ratio of COG categories of all sequenced bacterial genomes versus the Comau metagenome.

Values over 0 indicate categories that are enriched in the bacterial genomes versus the Comau metagenome, and values less than 0 indicate categories where the Comau metagenome is enriched versus all the bacterial genomes. With the exception of the cell cycle category, all other groups showed significant changes by two-tailed Fisher exact test, at 95% confidence level.
