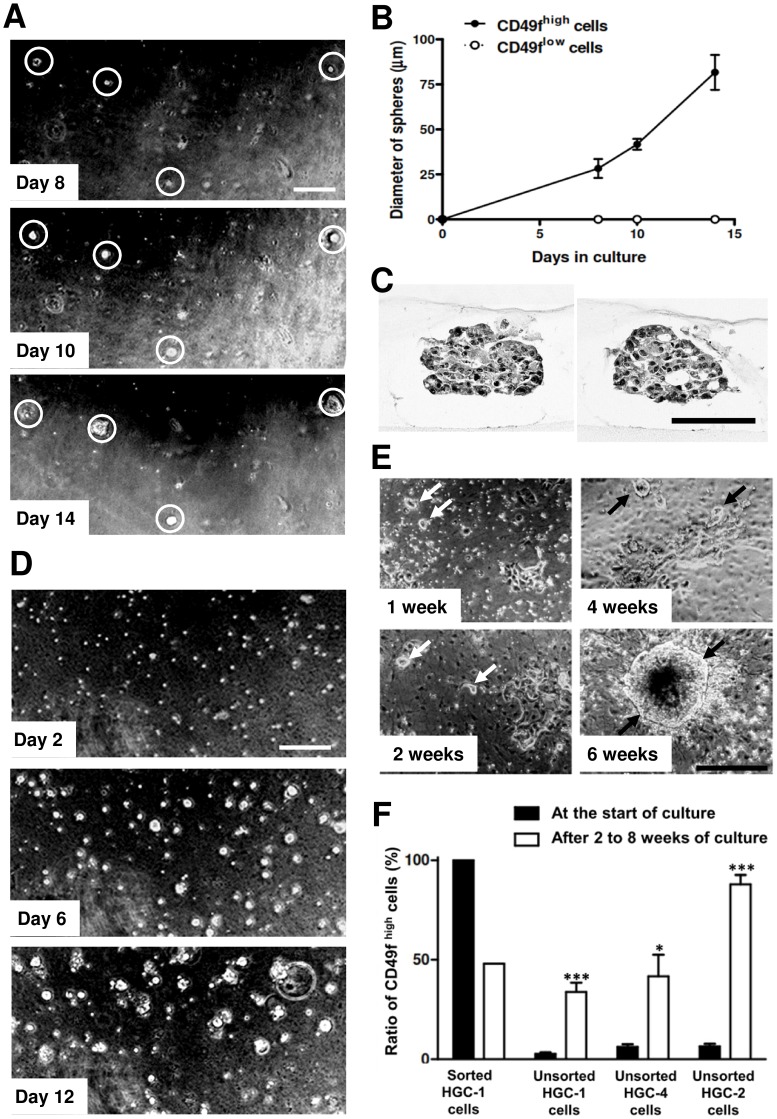
Figure 3. CD49fhigh cells form spheres in primary culture.
(A) Phase contrast micrographs showing the growth of spheres in culture of CD49fhigh HGC-1 tumor cells on collagen gel. The same area on days 8, 10 and 14 are shown. It is clear that spheres in the white circles grow rapidly in culture. Scale bar represents 200 µm. (B) The increase in diameters of spheres in culture of CD49fhigh HGC-1 tumor cells, shown in (A). (C) Light micrographs of spheres formed by culture of CD49fhigh HGC-1 tumor cells for 2 weeks. Tissue specimens are stained with PAS-hematoxylin. Scale bar represents 100 µm. (D) Phase contrast micrographs showing the growth of spheres in culture of unsorted HGC-4 tumor cells on collagen gel. The same area on days 2, 6, and 12 are shown. Scale bar represents 200 µm. (E) Phase contrast micrographs showing the growth of spheres in culture of unsorted HGC-2 tumor cells on collagen gel. Many flat cells closely attach to ECM to form a thin layer. Sphere-forming cells (arrows) grow slowly on the flat cells to form large spheres at 6 weeks. Scale bar represents 500 µm. (F) Changes in the ratio of CD49fhigh cells in total cells in culture of sorted CD49fhigh HGC-1 tumor cells (for 2 weeks), unsorted HGC-1 tumor cells (for 2 weeks), unsorted HGC-4 tumor cells (for 2 weeks) and unsorted HGC-2 tumor cells (for 8 weeks). Significant increases in the ratio of CD49fhigh cells are always found in culture of unsorted tumor cells. ***, P<0.001; *, P<0.05 by Student’s t-test.

