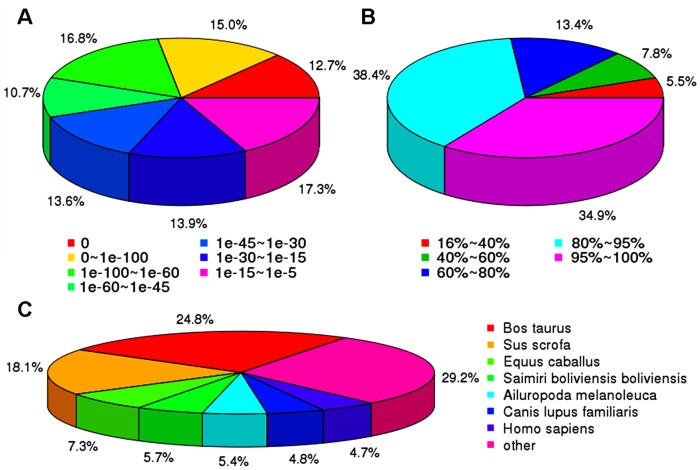
Figure 2. Characterization of the assembled unigenes against NR protein databases.
(A) E-value distribution of BLAST hits for the assembled unigenes with a cutoff of 1E-5. (B) Similarity distribution of the top BLAST hits for the assembled unigenes with a cutoff of 1E-5. (C) Species distribution of the top BLAST hits for the assembled unigenes with a cutoff of 1E-5.

