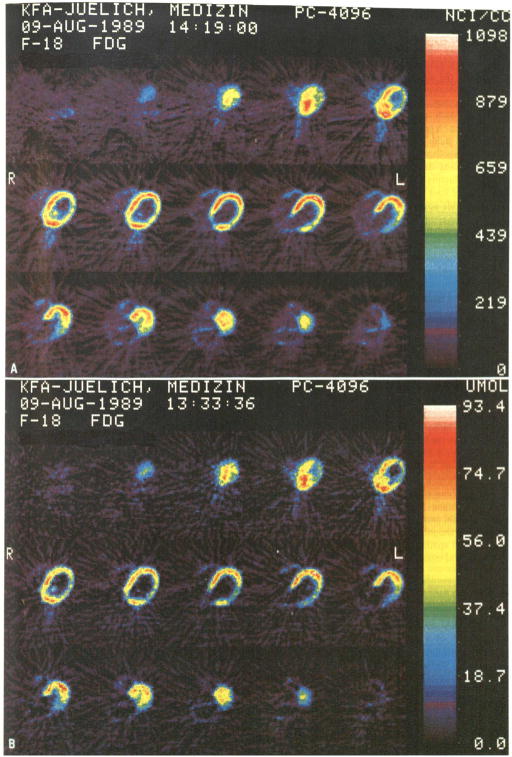
Fig. 5.
A, B .Dynamic PET investigation of the heart with FDG in a patient with myocardial infarction. Colour images of transaxial slices represent 18F concentration (A) and glucose consumption (B) in the myocardium. Note the “superimposed” consumption defect of the lateral wall in the consumption image, which is not as clearly visible in the original concentration images

