FIGURE 12.

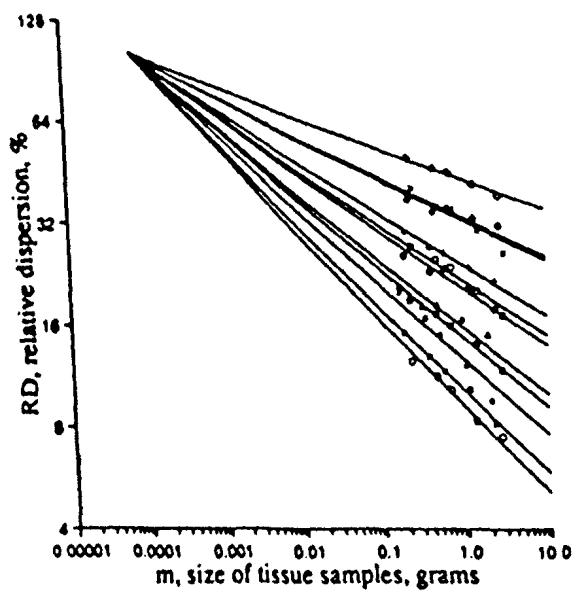
Projection of the fractal relationships for the relative dispersions of regional myocardial flows in 11 sheep through a common point. The best fit was obtained with m = 75 μg and RD = 102% (r = 0.975).

Projection of the fractal relationships for the relative dispersions of regional myocardial flows in 11 sheep through a common point. The best fit was obtained with m = 75 μg and RD = 102% (r = 0.975).