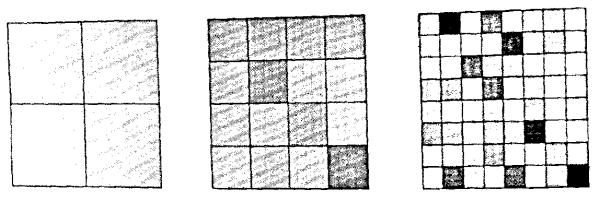
FIGURE 2.

Overlay of grids with differing mesh sizes on the array of uniform random points in Fig. 1. The gray shade assigned to each pixel indicates the % difference between the number of points in the pixel and the mean number of points per pixel at that pixel size. White indicates 20% below the mean and black 20% above the mean.
