FIGURE 3.

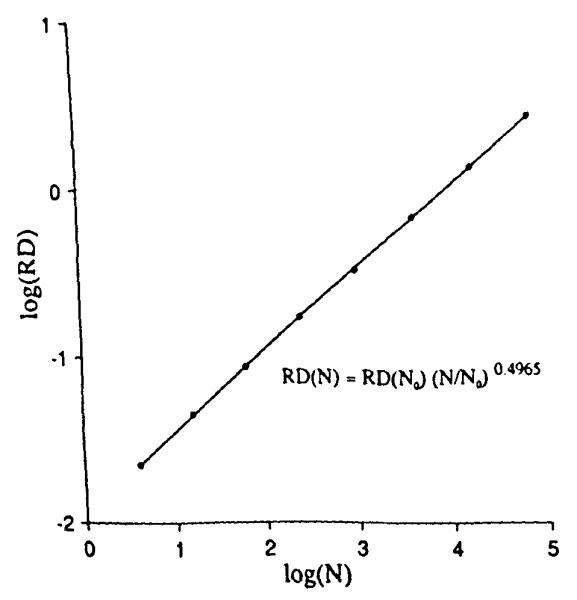
Relative dispersions obtained from the uniform random points of Fig. 1 as a function of the number of pixels (N) in the grid. The slope of the regression line is close to the theoretical value of 0.5.

Relative dispersions obtained from the uniform random points of Fig. 1 as a function of the number of pixels (N) in the grid. The slope of the regression line is close to the theoretical value of 0.5.