
FIGURE 2.
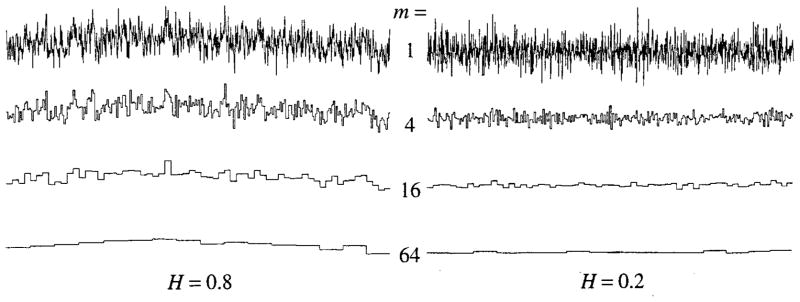
Successive averaging of quadruples of neighboring elements of one-dimensional fractional Brownian noise signals (N = 1024). The group sizes enlarge by a factor of four for each row from the top down; the group means are plotted over the range of m elements included in the group (Left panel) fBn with H = 0.8, or fractal D = 1.2. (Right panel) fBn with H = 0.2 or fractal D = 1.8.