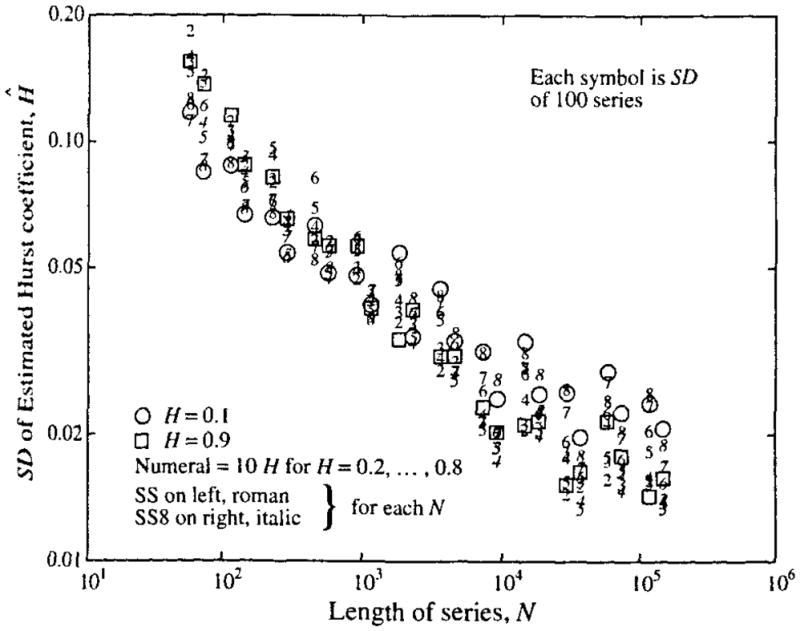
FIGURE 7.

Standard deviations of Ĥ from fractal time series: Series were of varied length N, given on the abscissa. For each point on the graph 100 time series of length N were generated by both the SS and SS8 methods. For each N, the mean of the 100 estimates of Ĥ on SS-generated series are on the left and the mean of the 100 estimates on the SS8-generated series on the right. The value for H used in the generation is given by the numeral located at the value of Ĥ, using Roman fonts for SS and italic fonts for SS8. Using Fisher’s F test for comparing the variances from SS-generated versus SS8-generated series, for 75% (or 81 of 108) of N, H pairs the SS series gave larger variances at level p ≥ 0.9.
