
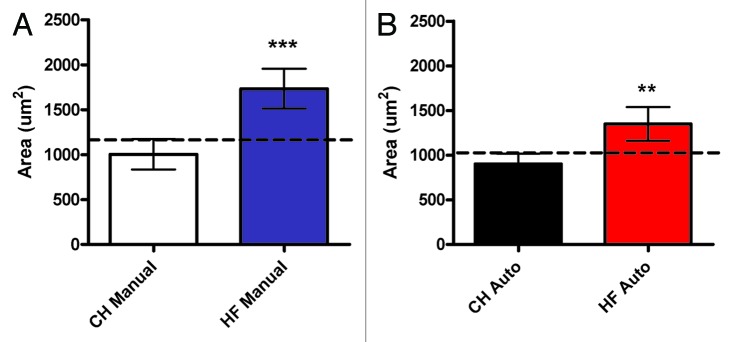
Figure 3. Comparison of mean adipocyte size derived from manual and automatic methods. Mean adipocyte size ± SD was calculated using at least 16 fields per whole-slide image, from at least 4 animals per group, chow (CH) of high-fat (HF) fed, using both manual ellipse measurements (A), and automatic pixel counting (B).