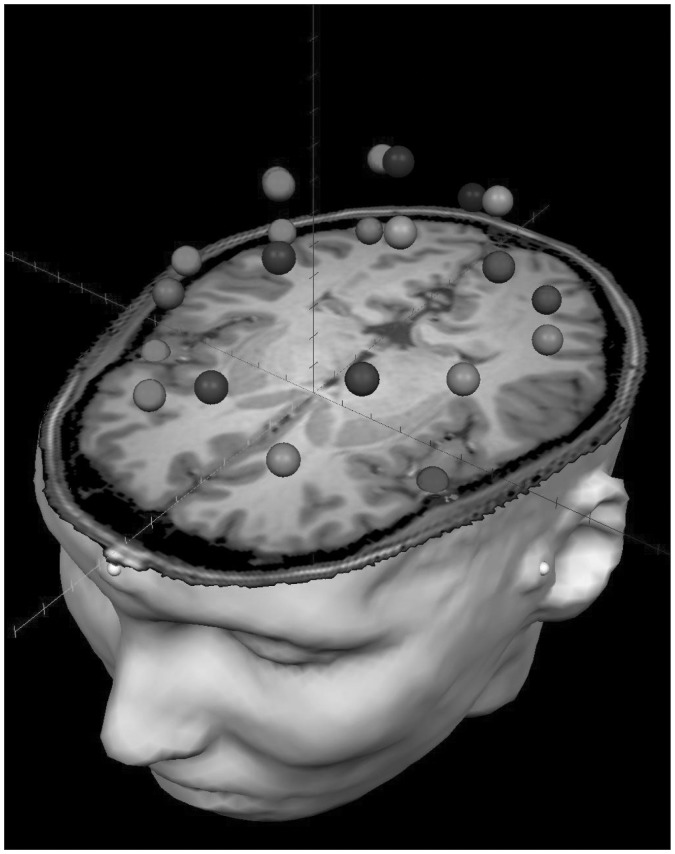
Fig. 1.
Example of the 29-node regional source model. For each participant, a 29-node model was fitted to their magnetic resonance imaging (MRI) scan after coregistration, and this model was used to estimate regional neuronal activity during the resting-state recording using inverse spatial filtering. The model can be seen overlaid on the MRI of a patient with attention-deficit/hyperactivity disorder. The distinct shades visually distinguish the regional sources. Note that sources are spaced equidistantly and that each represents neural activity over an extended cortical area (i.e., > 1 cm3). Each node’s time series reflects the average neuronal activity over that brain region and not the amount of activity at a precise anatomic coordinate (e.g., a voxel in Montreal Neurological Institute space). The 4 nodes corresponding to default mode network regions were the focus of all statistical analyses of the present study.

