
Table 3.
The pearson correlation coefficient and p value
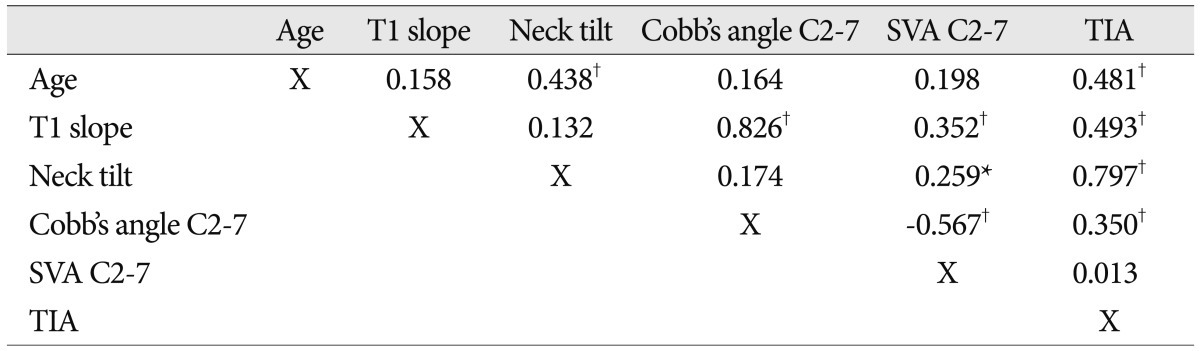
*Statistically significant values at the 0.05 level (2-tailed). †Statistically significant values at the 0.01 level (2-tailed). SVA : sagittal vertical axis, TIA : thoracic inlet angle
Official websites use .gov
A
.gov website belongs to an official
government organization in the United States.
Secure .gov websites use HTTPS
A lock (
) or https:// means you've safely
connected to the .gov website. Share sensitive
information only on official, secure websites.
The pearson correlation coefficient and p value
*Statistically significant values at the 0.05 level (2-tailed). †Statistically significant values at the 0.01 level (2-tailed). SVA : sagittal vertical axis, TIA : thoracic inlet angle