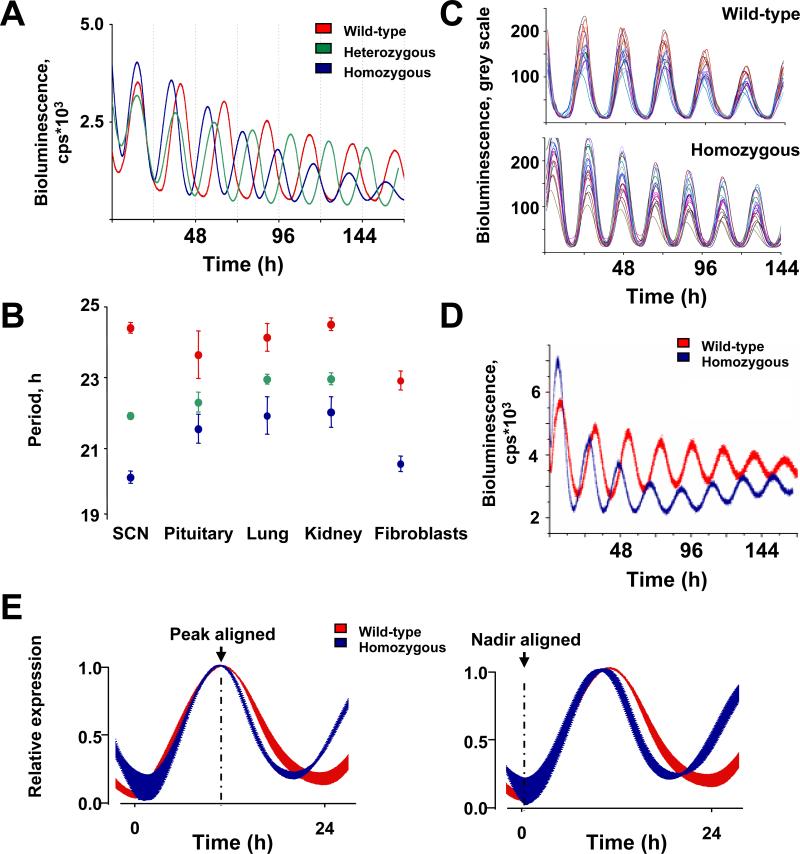
Figure 4. CK1εtau has a global impact on circadian pacemaking, accelerating molecular circadian oscillators in SCN, peripheral tissues and primary fibroblasts.
(A) Representative PER2::LUC bioluminescence oscillations in WT (red), heterozygote (green) and homozygote (blue) organotypic SCN slices.
(B) The periodicity of tissues from WT, heterozygote and homozygote tau PER2::LUC mice (mean±SEM; WT, n=4-6; heterozygotes, n=10-11; homozygote, n=5-6).
(C) CCD recordings of SCN PER2::LUC expression at the single cell level for WT and homozygote SCN slices (20 per slice; n=3 slices for each genotype).
(D) Representative traces of PER2::LUC expression in primary fibroblast cultures of WT (red) and tau mutant (blue) mice.
(E) Waveform alignments by nadir or peak for PER2::LUC rhythms from WT (red) and homozygote (blue) organotypic SCN slices. Data were normalised and then plotted as mean±SEM (n=6 per genotype). Note selective reduction in peak to nadir interval regardless of alignment.

