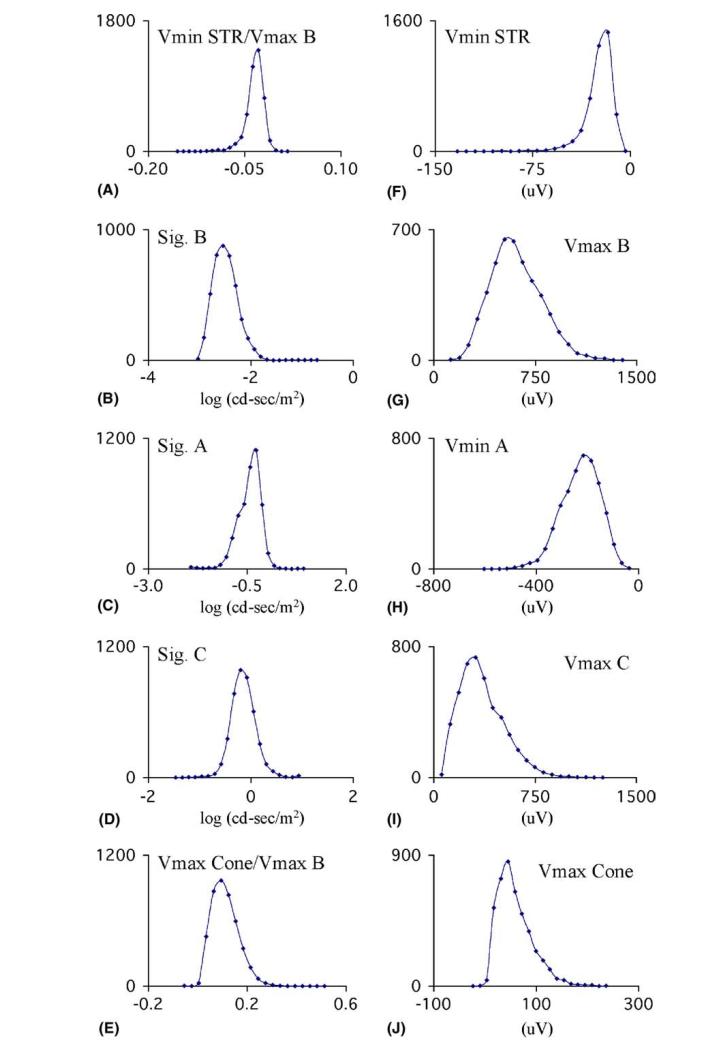
Figure 2.
Distribution of values found for variables associated with the electroretinogram of 4375 mice over a one-year period. (A) The amplitude of the negative component of the STR, normalized to the maximal amplitude of the b-wave. (B–D). log illumination required to evoke a response of half maximal amplitude for the b-wave, the a-wave and the c-wave. (E) Amplitude of the negative component of the cone response normalized to the maximal amplitude of the b-wave. (F) Negative component of the STR. (G–J) Maximal amplitudes of the b-wave, a-wave, c-wave and negative component of the cone erg.

