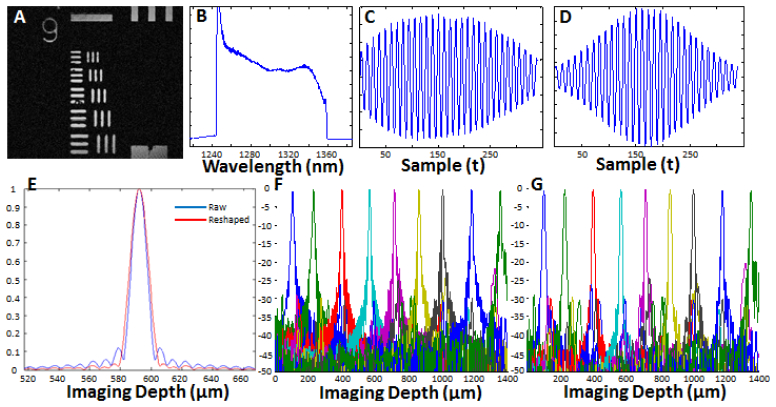
Fig. 2.
System characterization. A) OCM image of a USAF 1951 resolution test chart acquired with the 40X water immersion objective. B) Spectrum of the VCSEL measured with an optical spectrum analyzer showing a 117 nm tuning range. C) Mirror fringe signal acquired using optical clocking. D) Spectrally reshaped fringe signal. E) Axial PSF of the raw fringe (blue line) with 11.4 µm resolution in air (~8.1 µm in tissue), and spectrally reshaped fringe (red line) with 13.5 µm resolution in air (~9.6 µm in tissue). F) Sensitivity fall-off of the VCSEL swept source obtained from the raw fringes and spectrally reshaped fringes (G), showing no significant change in the signal sensitivity across the imaging range.

