
Fig. 3.
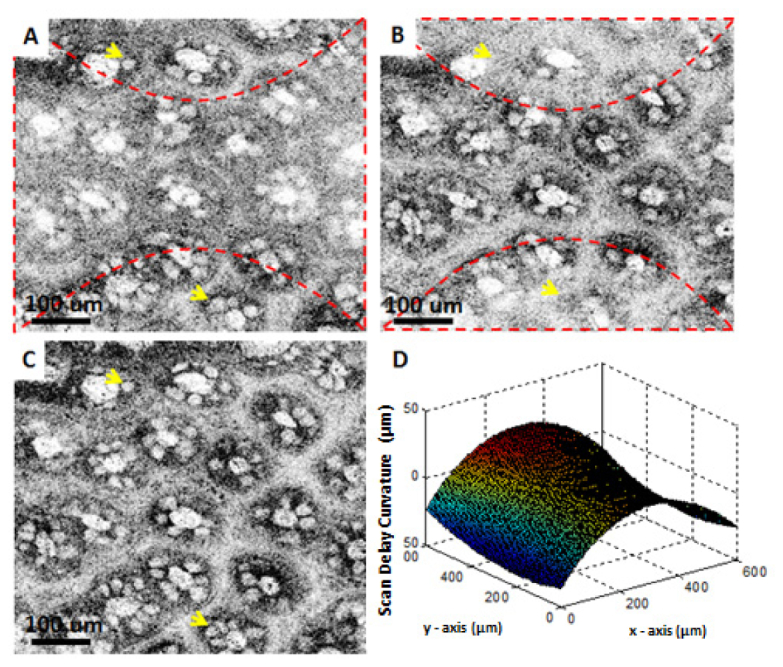
Correction of delay variation with scanning demonstrated in images of fresh human colon obtained ex vivo. (A) and (B) are from two different depths from the same data set, where (C) is the calibrated image. (D) shows a surface plot of the cover slip surface taken with the 40X/W objective. Dashed lines in (A) and (B) indicate the regions that are in focus for that particular depth. Arrows point to goblet cells.