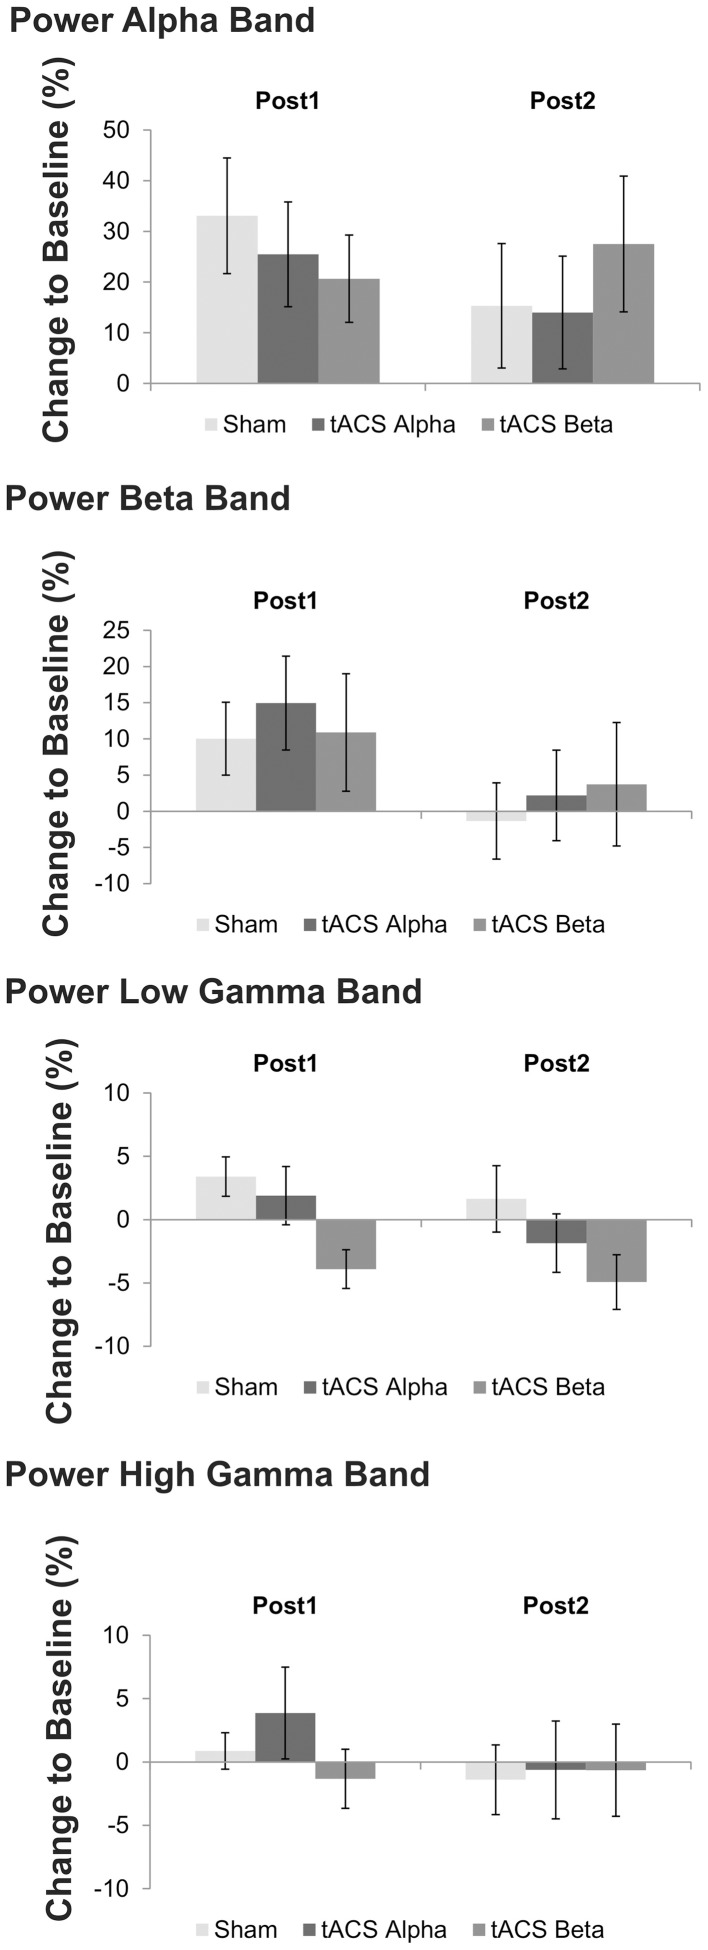
Figure 6.
Mean relative changes of power at the four frequency bands of interest following 10 Hz, 20 Hz and sham tACS. Error bars indicate standard error of mean. Please note that a trend toward a significant main effect of factor stimulation was found on low gamma band power, only. Post-hoc analysis revealed that low gamma band power following 20 Hz tACS was significantly reduced as compared to sham stimulation and 10 Hz tACS.

