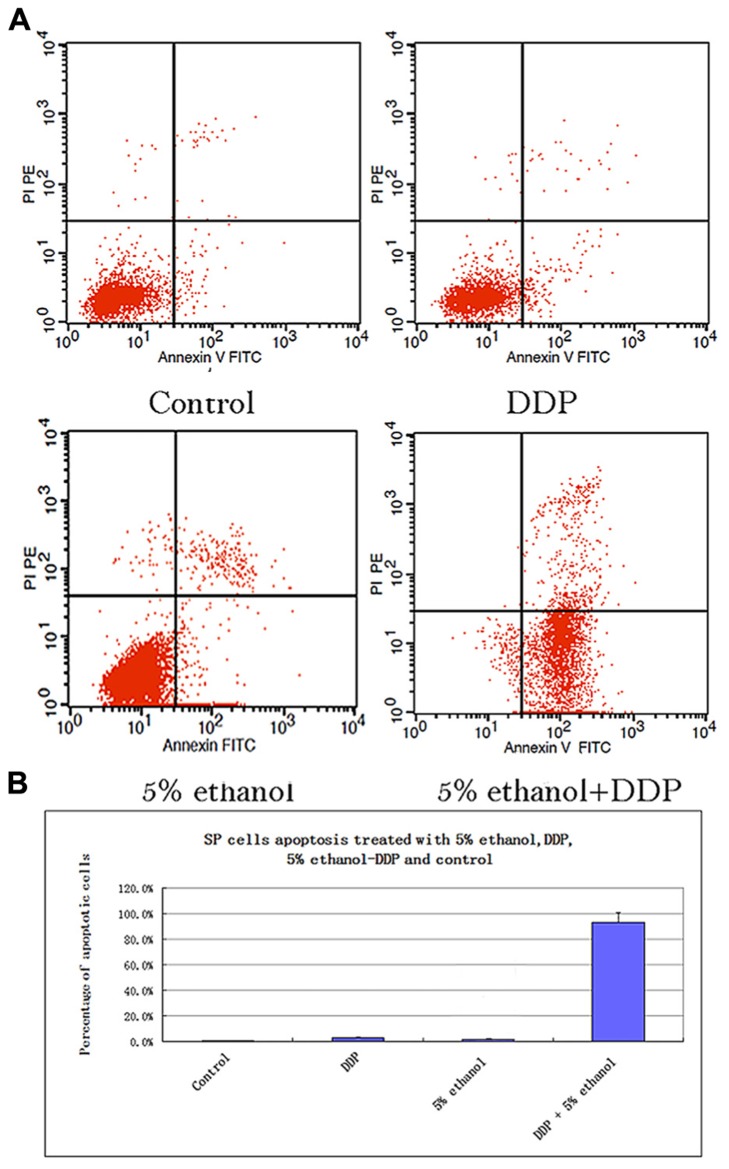
FIGURE 2.
(A) Apoptosis analysis of SP cells treated with 5% ethanol, DDP, 5% ethanol–DDP, and control by FACS. (a) Apoptosis of control SP cells. (b) Apoptosis of 5% ethanol-treated SP cells. (c) Apoptosis of DDP-treated SP cells. (d) Apoptosis of 5% ethanol–DDP-treated SP cells. (B) Apoptosis rate of treated SP cells. The most significant apoptosis rate was found in 5% ethanol–DDP-treated SP cells.

