
Figure 3. Bar Graphs Depicting the Treatment Effect Change.
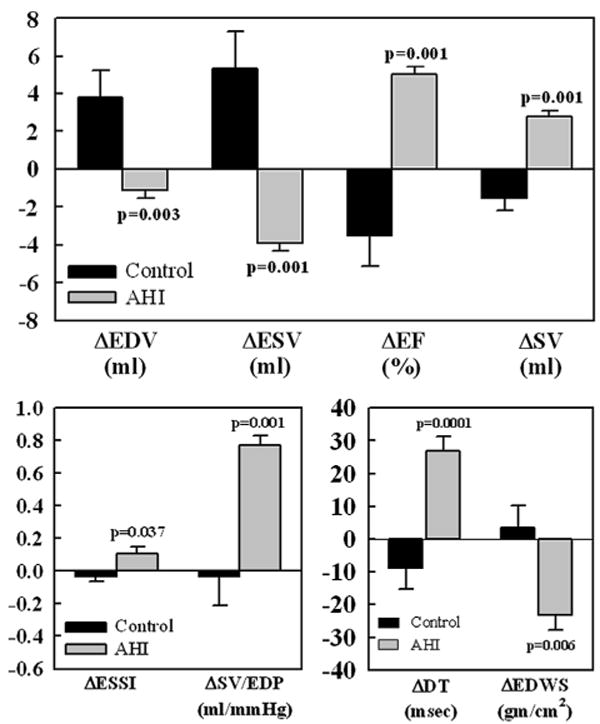
Change (Δ) between control dogs (black bars) and AHI-treated dogs (gray bars). The Δs represent the difference between pre-treatment and 17 weeks among the 2 treatment groups. Top: LV EDV, LV ESV, LV EF, and SV. Bottom left: LV end-systolic sphericity index (ESSI) and ratio of SV to LV end-diastolic pressure (SV/EDP). Bottom right: deceleration time of early mitral inflow velocity (DT) and LV end-diastolic circumferential wall stress (EDWS). Data are shown as mean ± SEM. P = Probability value between control and AHI. p Values are based on a t statistic for 2 means. Abbreviations as in Figure 2.