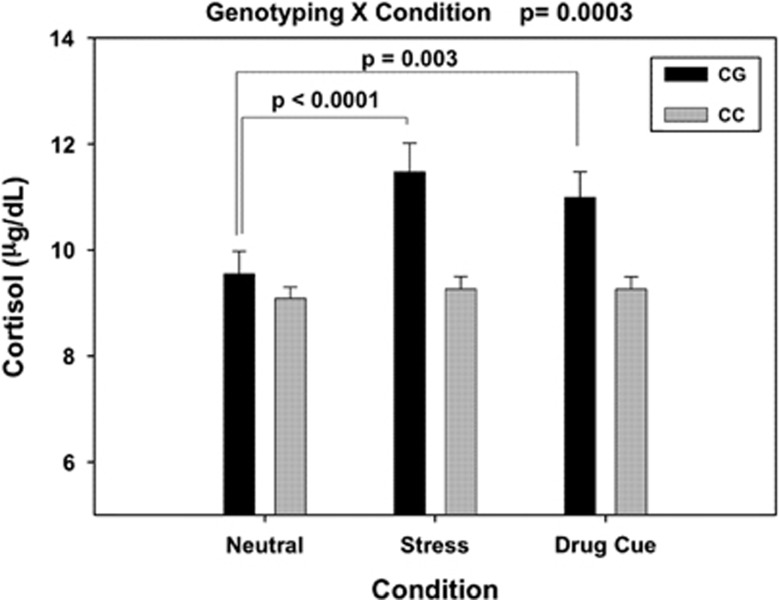
Figure 2.
Mean (and standard error) plasma cortisol levels averaged across all time points in the neutral (N), stress (S) and drug cue (T) conditions for the OPRK1 rs6989250 genotype groups are shown. There was a significant genotype–condition interaction (P=0.0003, Cohen's d=1.01), with CG individuals showing higher cortisol levels during stress compared with the neutral and drug cue conditions (P<0.0001 for stress versus neutral Cohen's d=1.46; P=0.003, Cohen's d=1.04 for cue versus neutral), whereas CC individuals showed no stress-induced increases in cortisol compared with their cortisol responses in the drug cue and neutral conditions (P's>0.05).

