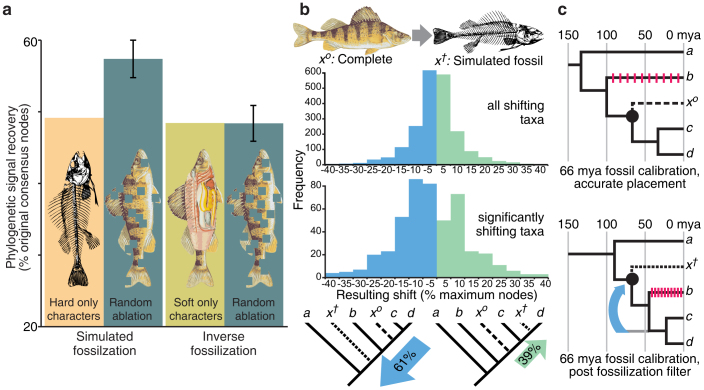
Figure 1. Results of simulated fossilization analyses.
(a) Node recovery test, indicating significantly lower phylogenetic signal recovery for simulated fossilization searches (hard characters only) vs random missing characters in the same amount, but not for inverse-fossilization searches (soft characters only). Node recovery is the proportion of 2022 original strict consensus nodes recovered with systematic missing data or random missing data (the later being an average of 500 iterations with twice standard deviation error bars); (b) Taxon shift test, where soft characters are removed from individual taxa to simulate fossilization. Histograms represent shift from original position (x o), to new position (x†) relative to the root for all simulated fossil taxa that moved (above) and simulated fossil taxa that exhibit significant shift, given random missing data (below). In the case of the later, 61% of 491 taxa shift significantly down phylogenies, from their original position toward the root, vs 39% which shift significantly up; (c) the effect of a downward shift of a fossil taxa in a phylogeny on estimates of rates of evolution and inferences of timing of evolutionary events (pink bars represent evolutionary changes e.g. DNA base pair change or acquisition of a morphological character). Images in Figure 1a adapted from Gilbert34 and Duane35.

