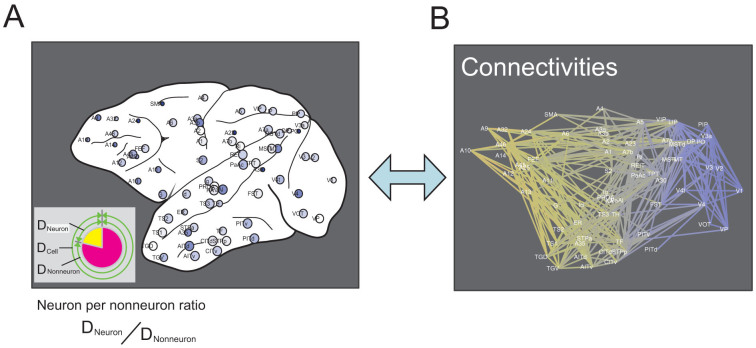
Figure 1. Concept of this study.
The main aim of this study was to compare cell densities (Figure A) and network organization, which consists of connecting brain regions (Figure B). As shown in Figure A, the cells were categorized into neurons and nonneurons. From these values, the neuron-per-nonneuron ratio was defined according to the equation shown below (A). The network organization was quantified using 27 network variables. Changes in color gradations correspond to the anterior–posterior coordinates.

