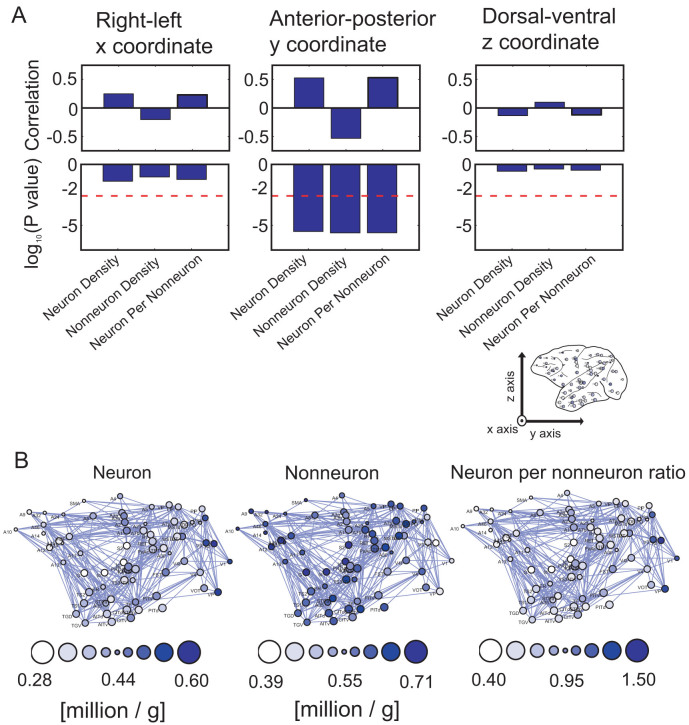
Figure 2. Coordinate dependencies of the cell densities.
The upper figures in Figure A show the correlations between the three spatial coordinates and cell densities. The lower figures indicate the p values of the t-test that correspond to these three correlations. The directions of the x, y and z axes are shown in the inserted figure of the brain at the bottom right of Figure A. The thick dotted line represents the threshold of significance (p < 0.05/9, t-test, Bonferroni correction). The figures in (B) represent the spatial distributions of these three cell densities on the y-z coordinates. From left to right, the three densities are the neuron density, glia cell density, and neuron-per-nonneuron density. Darker colored circles indicate higher densities or ratios, as shown in the bottom bubble. The sizes of the circles show the depth of the coordinates.

