
Figure 6. Principle component regression using both spatial coordinates and participation coefficient.
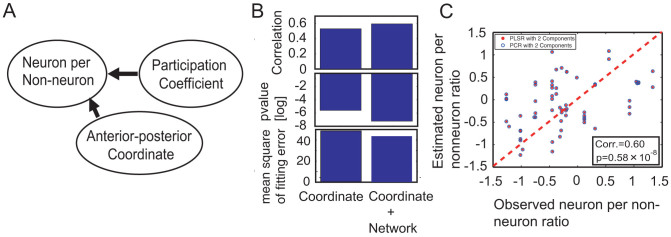
Figure A shows how accurately the neuron-per-nonneuron ratio can be estimated using the participation coefficient and spatial coordinate. Three panels in Figure B show the correlations between the estimated neuron-per-nonneuron ratios and observed neuron-per-nonneuron ratios, their p values (two sided t-test) and fitting error for PCR, respectively. The left bars indicate the results estimated from only the spatial coordinates, and the right bars indicate the results estimated from both the spatial coordinates and participation coefficients. As expected, the estimation was improved by including the participation coefficients. A direct comparison between the observed neuron-per-nonneuron ratio and the estimated neuron-per-nonneuron ratio from both the participation coefficient and anterior-posterior coordinate is shown in Figure C. The red dots and blue circles were estimated using PCR and PLSR, respectively. The red dotted line is the diagonal line.