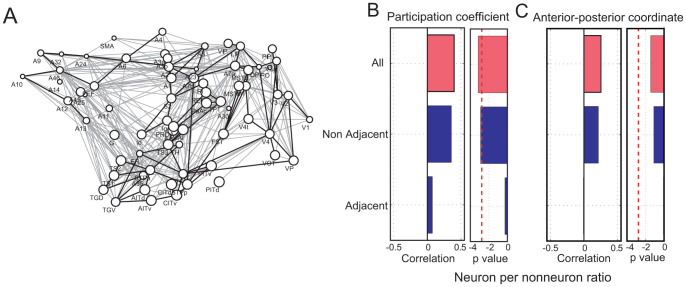
Figure 7. Comparison between adjacent and non-adjacent connections.
In Figure A, the thick lines indicate the connections between adjacent pairs of brain regions, and the remaining thin lines indicate the non-adjacent pairs. In Figure B, the columns with two panels show the correlations and p values between the neuron-per-nonneuron ratios and participant coefficients. The three bars in the left panel are, from top to bottom, the participation coefficient given for all networks, networks only between non-adjacent brain regions, and networks only between adjacent brain regions. Three bars in the right panel show p values corresponding to correlations in the left panel. The correlations and p values between the anterior–posterior coordinates and participation coefficients are shown in Figure C. The meanings of the three bars are the same as in Figure B.

