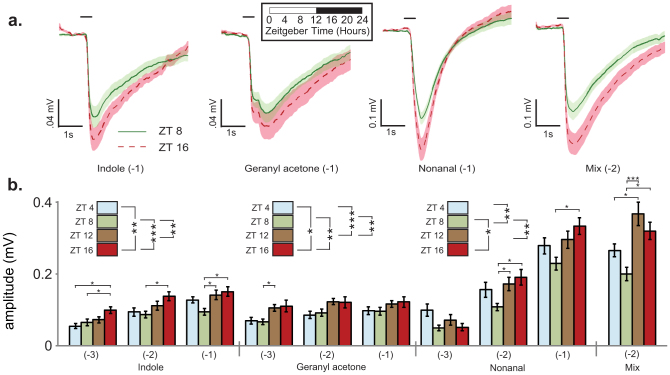
Figure 4. Time-of-day changes in mosquito olfactory sensitivity to hydrophobic host constituents.
(a) Electrophysiological analysis of adult female mosquito antennae at different times of the day. For each stimulus, the mean ± S.E.M. trace at ZT8 (afternoon) and ZT16 (night) are graphed. The black bar at 1.0 s indicates the onset of 0.5 s stimulus delivery. See Fig. S4 for dose-dependent traces. (b) EAG responses at different times of day and at different stimulus concentrations. Different stimulus compounds are indicated on the bottom horizonatal axis. Indole (two way ANOVA: Effect of time (t), F2,182 = 26.7, p < 0.001; effect of concentration (c), F3,182 = 9.7, p < 0.001; interaction (i), F6,182 = 0.7, n.s.); Nonanal (two way ANOVA: t, F3,192 = 7.2, p < 0.001; c, F2,192 = 155.6, p < 0.001; i, F6,192 = 1.8, n.s.); geranyl acetone (2 way ANOVA: t, F3,183 = 8.0, p < 0.001; c, F2,183 = 4.1, p < 0.05; i, F6,183 = 0.3, n.s.). Significant results of Tukey post hoc tests at each time-of-day (at a given concentration) are indicated above bar graphs. Overall effect of time-of-day indicated in panel legends. Significant time-of-day differences were also detected within mix (−2) using Dunn's method post hoc tests (Kruskal-Wallis ANOVA: H = 17.0, df = 3, p < 0.001). n = 12–24 recordings per group. Bar charts represent mean ± S.E.M values. *p < 0.05, **p < 0.01, ***p < 0.001.

