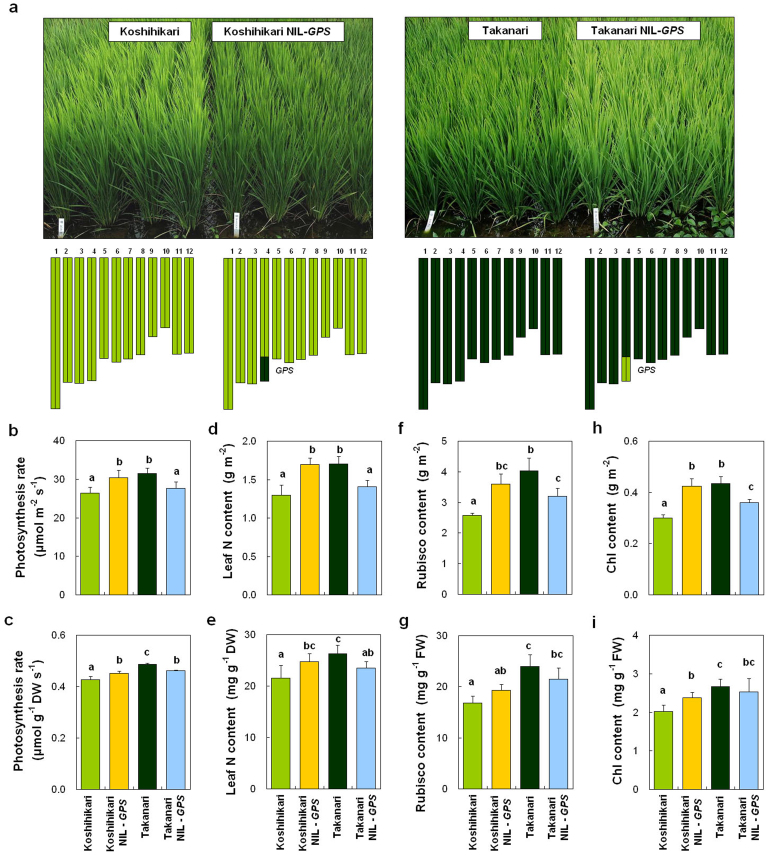
Figure 2. Physiological characterization of GPS alleles.
(a) Plant morphology and graphical genotypes of Koshihikari, Koshihikari NIL-GPS, Takanari, and Takanari NIL-GPS. Yellow-green bars, chromosome regions from Koshihikari; dark green, Takanari. (b–i) Comparisons of photosynthesis rate (b, c), leaf N content (d, e), Rubisco content (f, g), and chlorophyll (Chl) content (h, i) of flag leaves at full heading stage. Each column represents mean ± s.d. (n = 9). Different letters indicate significant difference at the 5% level (Tukey–Kramer HSD test).

