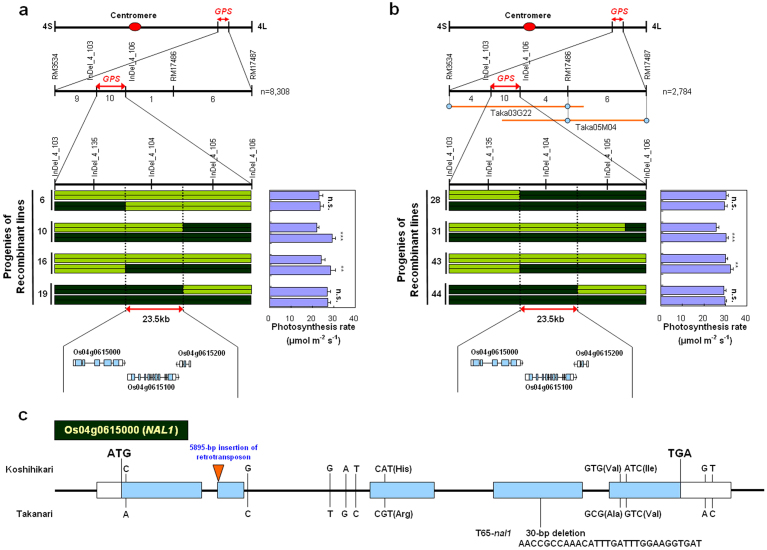
Figure 4. Molecular cloning of GPS.
(a, b) High-resolution linkage map of GPS region produced with 8308 F2 plants in the Koshihikari background (a) and 2784 F2 plants in the Takanari background (b). Populations were produced by crossing each cultivar with the corresponding NIL-GPS. The number of recombinants between molecular markers is indicated below the second line in each figure part. Yellow-green shading, regions homozygous for alleles from Koshihikari; dark green, Takanari. Each purple bar in the photosynthesis rate graphs represents the mean ± s.d. (n = 6) of the adjacent genotype. ***P < 0.001; **P < 0.01; n.s., not significant within pairs of recombinant lines (Student's t-test). (c) Gene structure and mutation sites of NAL1 in Koshihikari, Takanari, and nal1 mutant line in Taichung 65 genetic background (T65-nal1). Light blue bars represent exons; white bars represent 5′ and 3′ untranslated regions.

