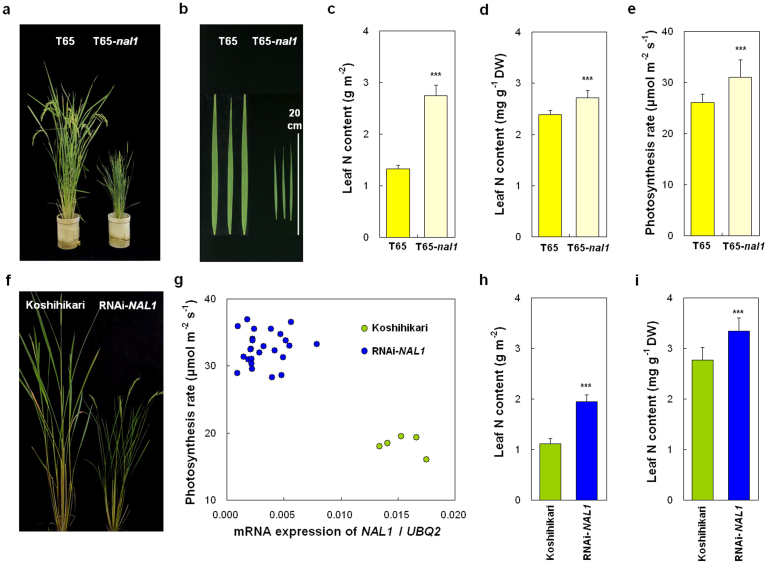
Figure 5. Plant morphology and photosynthesis rate in mutant and transgenic plants with differing expression of NAL1.
(a, b) Plant morphology (a) and flag leaves (b) of Taichung 65 (T65) and nal1 mutant line in T65 genetic background (T65-nal1). (c–e) Comparison of N content per unit leaf area (c), N content per unit dry mass (d), and photosynthesis rate (e) of flag leaves at full heading stage between T65 and T65-nal1. Each column represents mean ± s.d. (n = 10); ***P < 0.001 versus T65 (Student's t-test). (f) Plant morphology of Koshihikari and transgenic plants with RNAi-induced suppression of NAL1 in the Koshihikari genetic background (RNAi-NAL1). (g) Relationship between expression level of NAL1 and photosynthesis rate of flag leaves at full heading stage in Koshihikari and RNAi-NAL1 T0 plants. Each circle represents an individual Koshihikari or T0 plant. (h, i) Comparison of N content per unit leaf area (h) and per unit dry mass (i) between Koshihikari and RNAi-NAL1. Each column represents mean ± s.d. (n = 25 for RNAi-NAL1, n = 5 for Koshihikari); ***P < 0.001 versus Koshihikari (Student's t-test).

