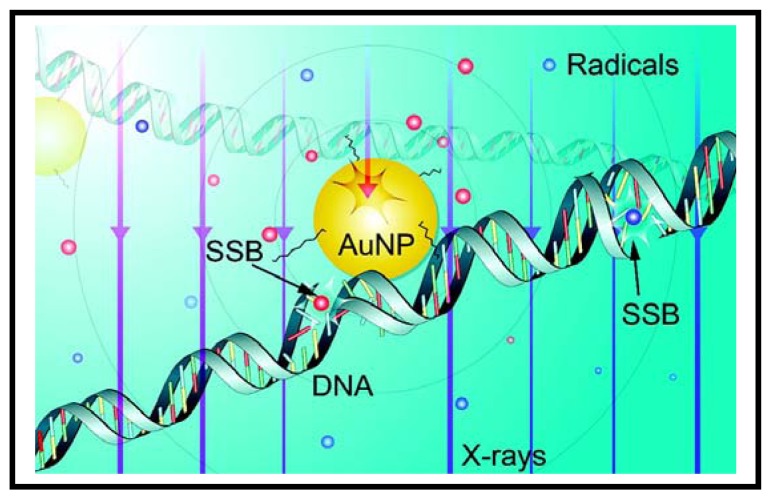
Figure 3.
Mechanisms of radiation induced DNA damage in the presence of the GNPs: Schematic diagram of the results of a Monte Carlo simulation. Also shown are the radicals (blue spheres, distributed evenly) generated from electrons produced in water, as well as radicals (red spheres, concentrated near the GNP) from Auger electrons, secondary and photoelectrons originated from the GNP. The trajectories of electrons are not shown, and only the relative average density of radicals generated from these electrons is displayed. The diameter of the GNP shown here is approximately 3 nm. Reproduced with permission [38].

