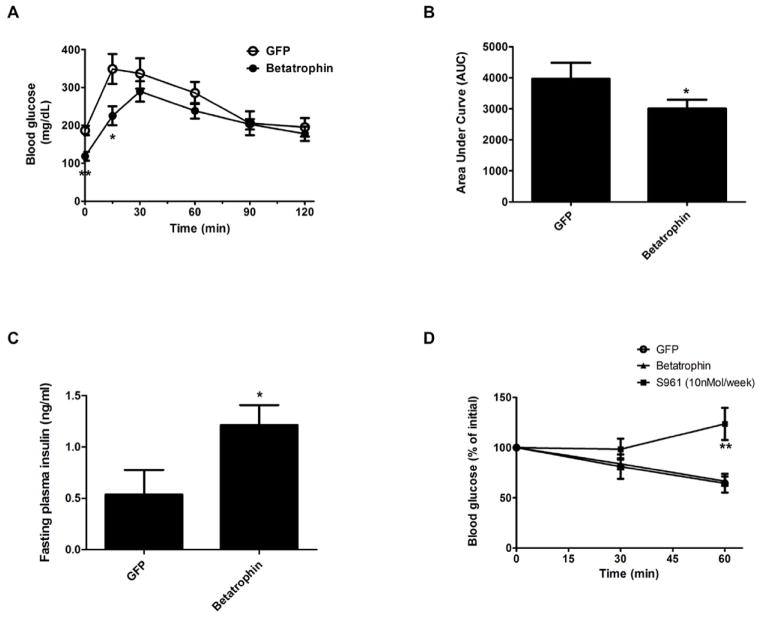
Figure 6. Overexpression of betatrophin in the liver leads to improved β cell function.
(A) Glucose tolerance test in GFP (n=5) or betatrophin (n=7) expressing mice shows a lower fasting blood glucose and an improved glucose tolerance induced by betatrophin expression. (B) Area Under Curve (AUC) for the glucose tolerance test Shown in A. (C) Fasting plasma insulin measurement in GFP (n=5) or betatrophin (n=7). (D) Insulin tolerance tests on GFP (n=5) or betatrophin (n=4) expressing mice show no sign of insulin resistance, in contrast to S961 (10nMol/week) treated animals (n=5), which show severe insulin resistance. (* indicates that p<0.05, and ** indicates that p<0.005 compared to control injected animals). Data are represented as mean +/− SEM. See also Figure S6.

