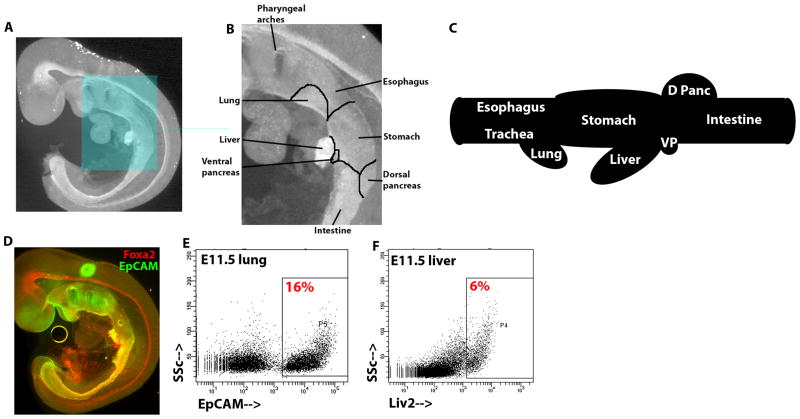
Figure 1.
Diagrams and isolation strategy of endodermal organ domains. (A) E9.5 embryo wholemount immunofluorescence image of Foxa2 antibody staining. Boxed region is magnified in (B), and the nascent organ domains within the continuous endodermal epithelium are demarcated and labeled. (C) Schematic of the gut tube at E11.5 with the distinct organ domains labeled. (D) E9.5 embryo wholemount immunofluorescence image of Foxa2 (red) and EpCAM (green). (E and F) Flow cytometric analysis of live, dissected (E) E11.5 lung stained with EpCAM (X-axis) and (F) E11.5 liver stained with Liv2 (X-axis), plotted against side scatter (Y-axis). The percentage of cells within the boxed region is displayed.

