Figure 4.
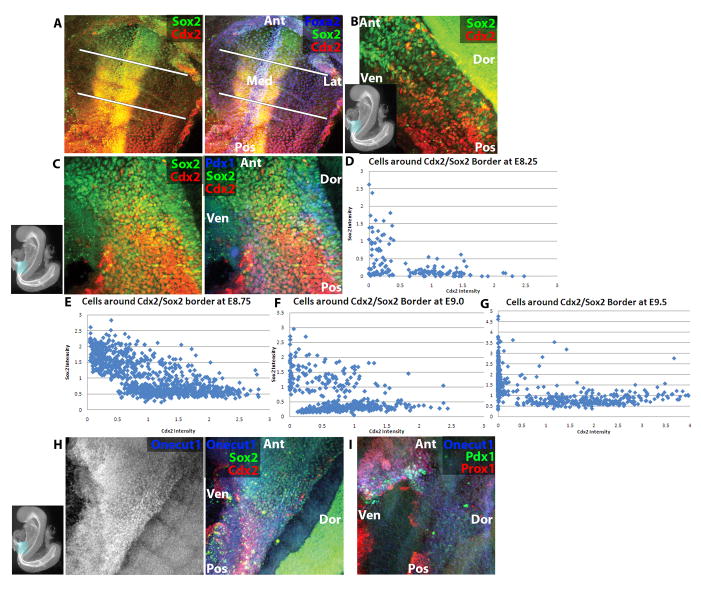
Anterior-posterior transcriptional dynamics at the stomach-intestine border. (A) E8.25 (4–6-somite stage) embryo wholemount confocal immunofluorescence image of Sox2 (green), Cdx2 (red) and Foxa2 (blue, right only). White lines demarcate region of endoderm expressing neither Cdx2 nor Sox2. (B) E8.5 (9–11-somite stage) embryo wholemount confocal immunofluorescence image of Sox2 (green) and Cdx2 (red). (C) E8.75 (13–15-somite stage) embryo wholemount confocal immunofluorescence image of Sox2 (green), Cdx2 (red) and Pdx1 (blue, right only). (D–G) Graphs plotting mean nuclear intensity ratio of Cdx2 (X-axis) to Sox2 (Y-axis) in populations of cells spanning the stomach-intestine border at E8.25 6–8-somite stage (D), E8.75 (E), E9.0 (F), and E9.5 (G). Each dot represents one nucleus, and intensity values of Cdx2 and Sox2 are normalized as ratios to Foxa2 expression. (H) E8.5 (6–8-somite stage) embryo wholemount confocal immunofluorescence image of Sox2 (green, right only), Cdx2 (red, right only) and Onecut1 (blue). (I) E8.75 (11–13-somite stage) embryo wholemount confocal immunofluorescence image of Pdx1 (green), Prox1 (red) and Onecut1 (blue). In thumbnail images, boxes highlight displayed region, and axes of embryo are labeled. Ant=Anterior, Pos=Posterior, Med=Medial, Lat=Lateral, Dor=Dorsal, Ven=Ventral.

