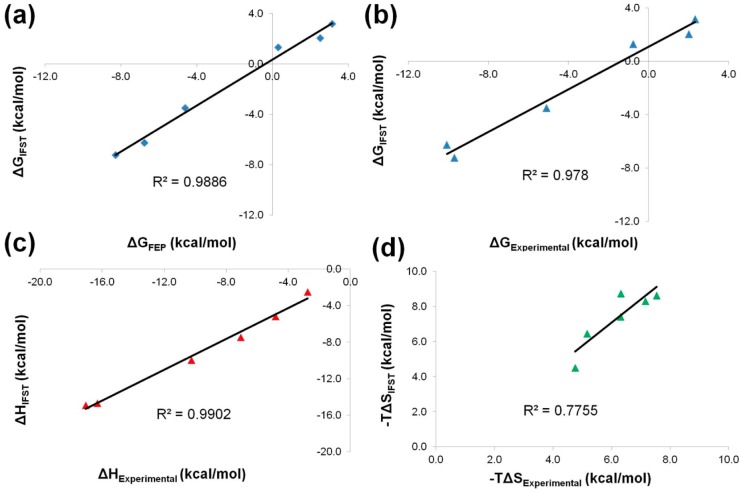
Figure 5.
Correlation plots between ΔG, ΔH, and TΔS for experiment and the predictions of FEP and IFST. Plots of the correlation between (a) ΔGIFST and ΔGFEP with blue diamonds, (b) ΔGIFST and ΔGExperimental with blue triangles, (c) ΔHIFST and ΔHExperimental with red triangles, and (d) TΔSIFST and TΔSExperimental with green triangles.

