
Figure 6.
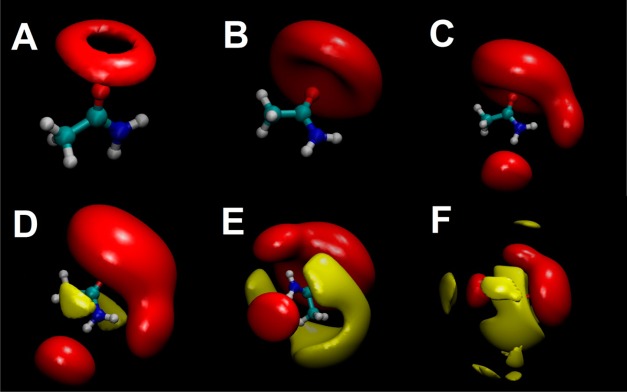
Visualizations of the relative free energy density relative to bulk water for regions surrounding acetamide. Six views of acetamide, with the relative free energy density contoured at different levels. Favorable relative free energy density is contoured in red and unfavorable relative free energy density is contoured in yellow. The contouring for the favorable relative free energy increases from (A) to (B) to (C). The contouring for the unfavorable relative free energy decreases from (D) to (E) to (F).