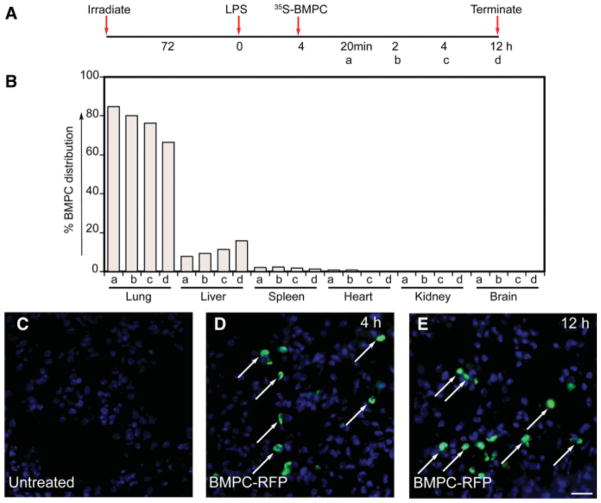
Figure 2.
mBMPCs distribution in lungs and other tissues. (A): Schematic of experimental timeline. (B): 35S-Met/Cys-labeled mBMPCs were administered via the retro-orbital vein. Lung, liver, spleen, heart, kidney, and brain tissues were collected at (a) 20 minutes, (b) 2 hours, (c) 4 hours, or (d) 12 hours after LPS (7.5 mg/kg BW) treatment. Tissues were washed briefly with phosphate-buffered saline. Tissue wet weights were recorded and radioactivity (CPM per gram of tissue) was measured. Total radioactivity (4 × 10⁵ per cell per mouse) before injection was calculated as 100% mBMPCs at 0 minutes. Data represent average percentage of mBMPCs distribution per gram of tissue obtained from three mice for each time point. The experiment was repeated two times. (C–E): Representative images of distribution of RFP-labeled mBMPCs at 4 and 12 hours were also examined by staining with rabbit anti-RFP polyclonal antibody (fluorescein isothiocyanate, green). Magnification 400×. Scale bar, 100 μm. Abbreviations: BMPCs, bone-marrow-derived progenitor cells; BW, body weight; LPS, lipopolysaccharide; RFP, red fluorescent protein.

