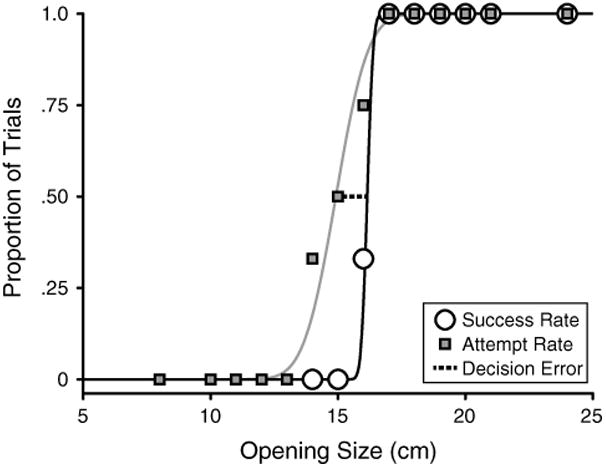
Fig. 2.

Affordance function (black curve) and decision function (gray curve) fit to a typical participant's attempts and decisions, respectively, in the doorway condition. Thresholds were estimated at the 50 % point of each function. Decision error is the difference between the two thresholds. This participant's decision threshold was smaller than her affordance threshold, indicating that she attempted some openings that were too small
