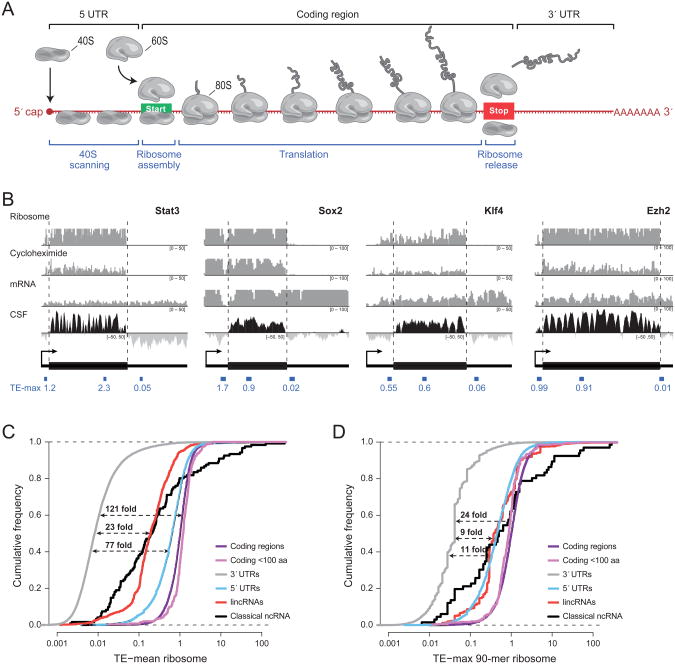
Figure 1. Properties of the translational efficiency score.
(a) An overview of mRNA translation. (b) Examples of ribosome profiling data over four mRNAs: Stat3, Sox2, Klf4, and Ezh2. The first three rows show, respectively, the sequencing coverage in counts (y-axis) of the ribosome-associated fraction, ribosome-associated fraction after treatment with cycloheximide, and polyA-selected total RNA per nucleotide (x-axis) on the associated transcript. The fourth row shows the codon substitution frequency (CSF) score across the mRNA which indicates the degree to which the sequence shows the evolutionary conservation pattern expected in protein-coding regions. Black corresponds to conserved coding potential (CSF>0) and light grey to lack of conserved coding potential (CSF<0). Dashed lines correspond to the boundaries of the coding region of the mRNA and the location and score of the max 90-mer translational efficiency (TE) score is shown for the 5′-UTR, 3′-UTR (thin black boxes), and coding region (thick black boxes). (c) Cumulative distribution of the average TE score across coding regions (purple line), small coding regions (magenta line), 3′-UTRs (gray line), 5′-UTRs (blue line), classical ncRNAs (black line), and lincRNAs (red line). The dashed lines show the median separation relative to 3′-UTRs for 5′-UTRs (bottom), lincRNAs and classical ncRNAs (middle line), and coding regions (top line). (d) Cumulative distribution of the TE computed using the max 90-mer window across the same classes. See also Figure S1.

