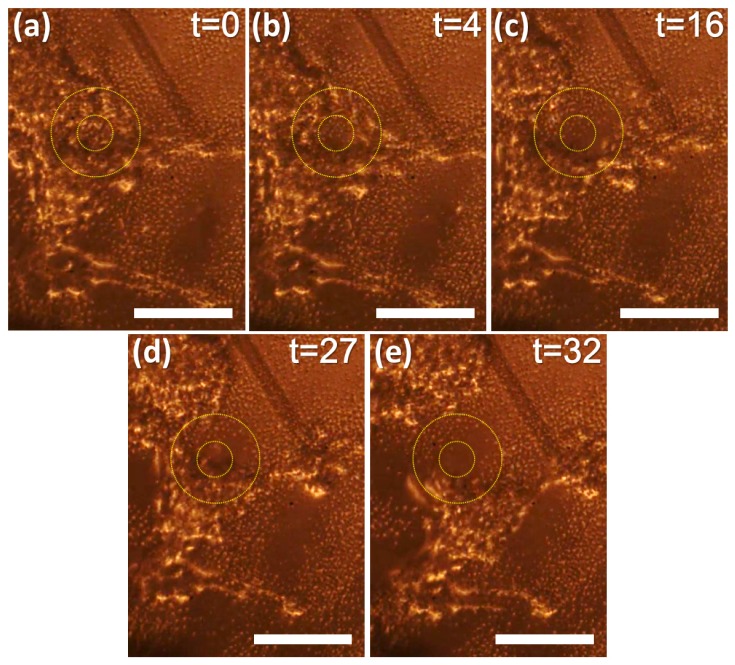
Fig. 2.
Demonstration of micro-fractionation by LGFU (Media 1 (4.2MB, MOV) ) (scale bar = 100 μm). The LGFU spot is fixed while the cell culture plate is slowly moved to the upper-right direction (a-e). For convenience, the disruption zones are guided by the inner and outer circles (35 and 90 μm in diameter, respectively). A captured time (t) is shown on the right-top corner (unit: second): (a) The cultured cell cluster is shown with a target spot; (b) Under LGFU, the cluster is fractionated primarily at the focal center; (c) The prolonged exposure of LGFU enlarges the fractionated zone over the periphery; (c-e) As we move the cluster, LGFU finally cleaves it into two pieces.

