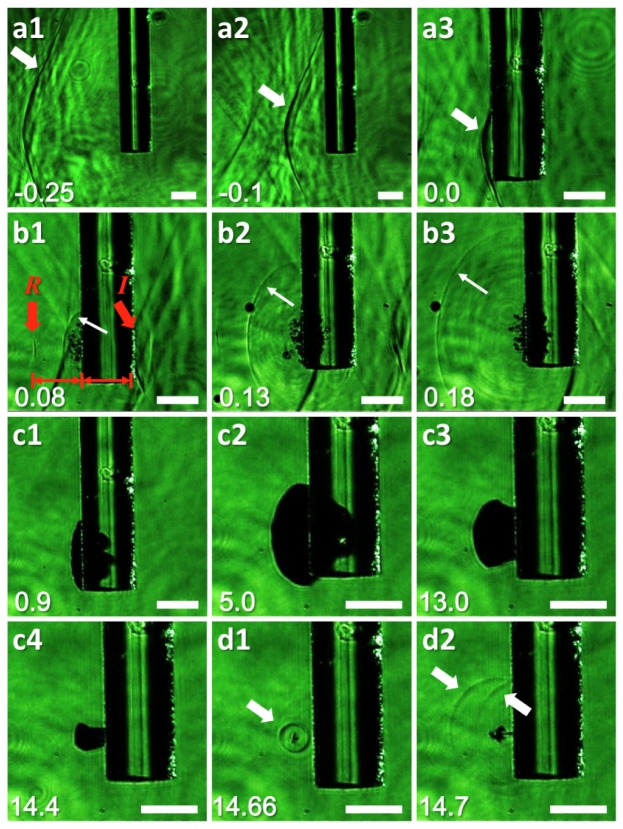
Fig. 4.
Shadowgraphic imaging of LGFU-induced disruptions (all scale bars: 100 μm). Instantaneous images are shown sequentially. A captured time is shown on the left bottom (unit: μs) as relatively defined from the moment of cavitation inception. The fiber thickness is 125 μm for all figures: (a1-a3) Incidence of LGFU from the left to the right. The wavefronts are indicated by the arrows; (b1-b3) Tiny bubbles generated under LGFU with the outgoing pressure wave (thin red arrow); (c1-c2) A cloud formation by the merged bubbles; (c3-c4) Shrinkage steps; (d1) A collapse-induced shock is shown as the spherical wavefront (arrow); (d2) Shock propagation is shown by the left arrow (a direct outgoing wave) and the right arrow (a reflected wave from the substrate).

