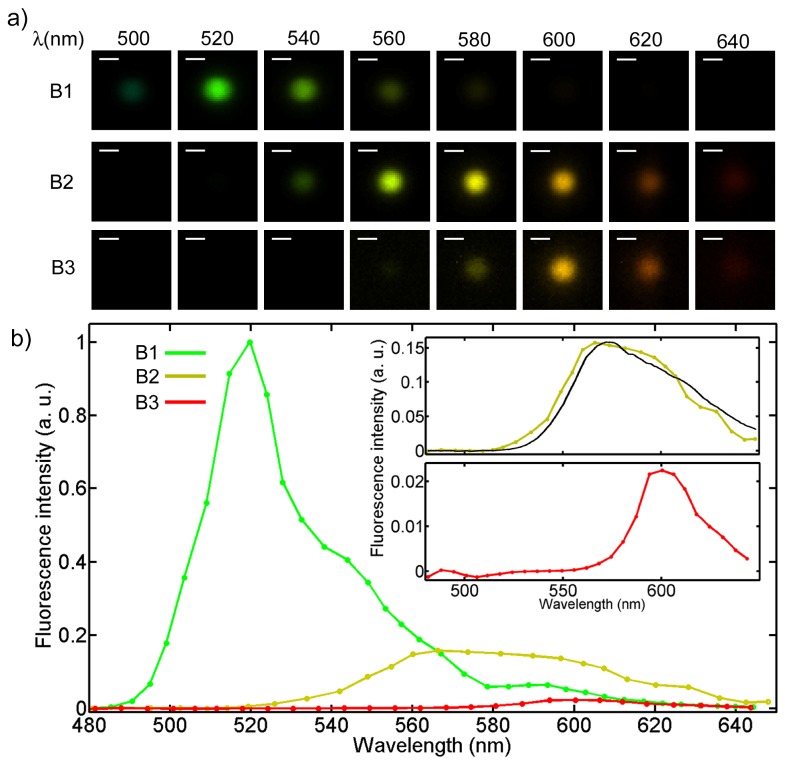
Fig. 3.
Hyperspectral imaging of fluorescent beads. a) Hyperspectral image set of the fluorescence emission from three types of beads. The false colors fit the corresponding wavelengths. Scale bar is 2 µm. b) Fluorescence intensity for the three types of beads as a function of the emitted wavelength. In the inserts, the plots relative to beads B2 and B3 are shown, where a different scale for the fluorescence intensity has been used. The black line refers to the spectrum for the beads B2 acquired with a spectrometer.

