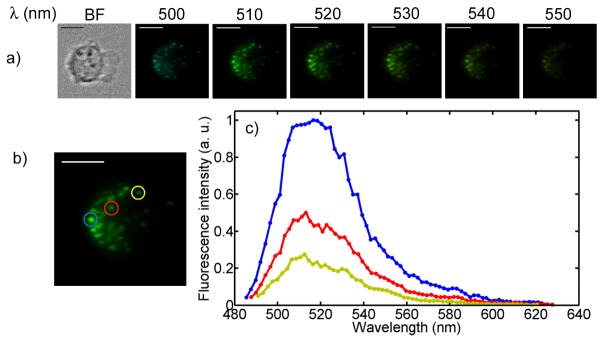
Fig. 5.

Organelle fluorescence spectroscopy. a) Bright field and six fluorescence images of GFP labeled peroxisomes inside K562 cells. The false colors fit the corresponding wavelengths. b) The fluorescence intensities of the three indicated organelles are plotted. Scale bars are 10 µm.
