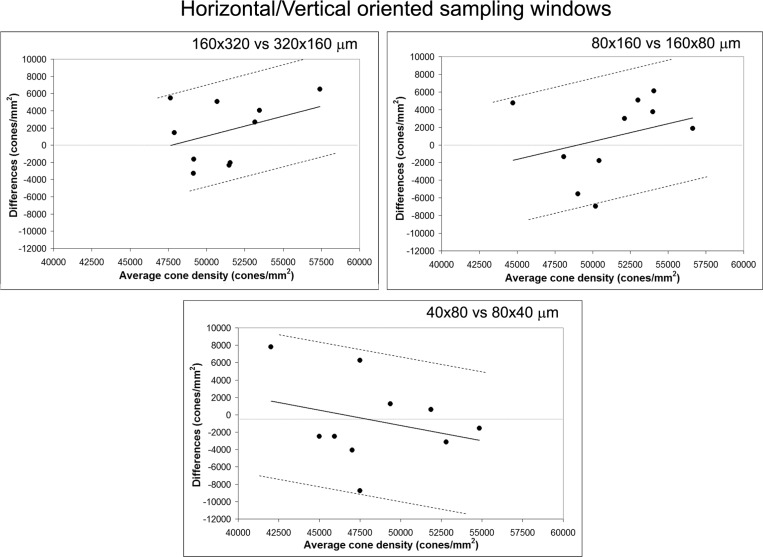
Fig. 3.
Bland-Altman plots showing the agreement between cone density values calculated within horizontal and vertical oriented sampling windows of same size at the 1.20 degree nasal retinal location. Average and difference density values between sampling windows are plotted in the x- and y-axes respectively. The presentation of the 95% limits of agreement is for visual judgement of how well two methods of measurement agree. The smaller the range between these two limits the better the agreement is. The average difference and the distribution of points across the diagram, however, provide further information on the agreement between the two measurements. A wide 95% CI has been calculated between sampling windows of different orientation and same size.

