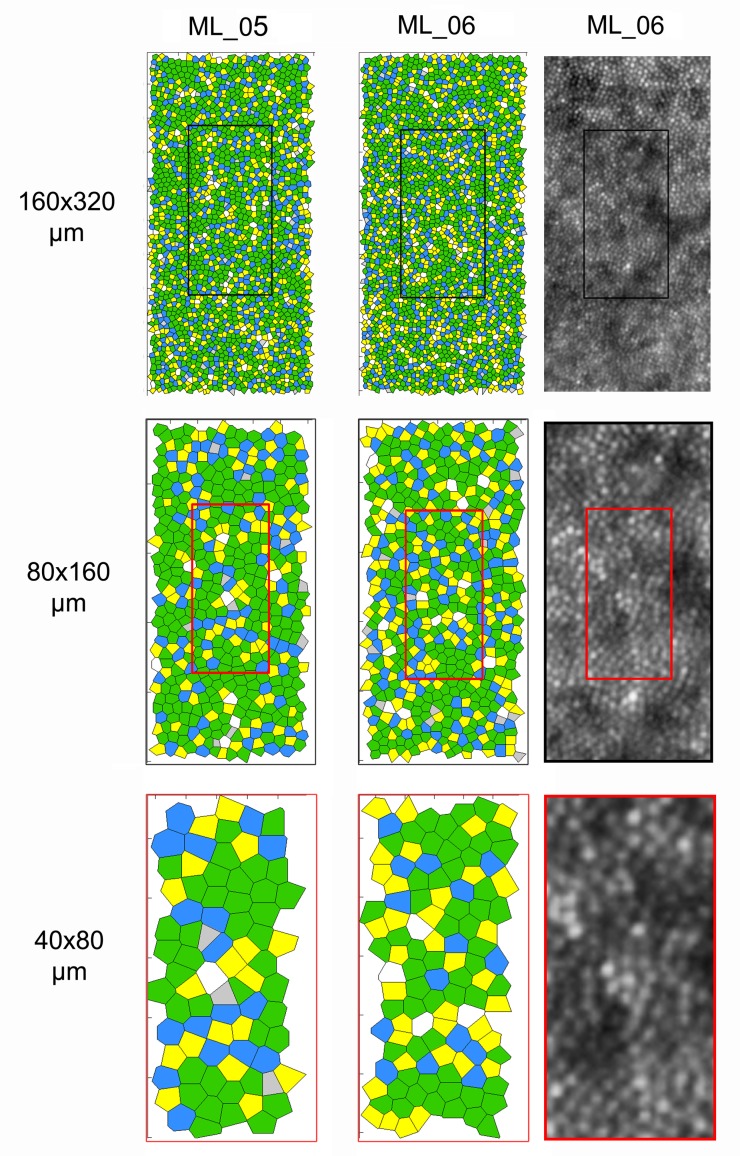
Fig. 5.
Voronoi maps obtained from cone coordinates estimated within the three sampling vertical window conditions at the nasal fixation location in two subjects (ML_05 and ML_06). The percentage of 6n arrangements (green tiles) is 50.9% and 47.5% within the 160x320 µm windows respectively. It was 56.2% and 46.4% within the 80x160 µm windows and 50.6% and 51.3% within the 40x80 µm windows respectively. In subject ML_06 (i.e., the case showing the lower % of 6n arrangement), the percentage of 5n arrangement (yellow tiles) increased from 26.6% to 31.9% from the largest to the smallest sampling window. The corresponding images of the cone mosaic at the same retinal location are shown for subject ML_06. The boundary effect may influence the estimation of the preferred packing arrangement of cones near the edge of the image section. The algorithm’s performance and the subsequent manual check to identify cones are additional sources of error for accurate reconstruction of a Voronoi map.

