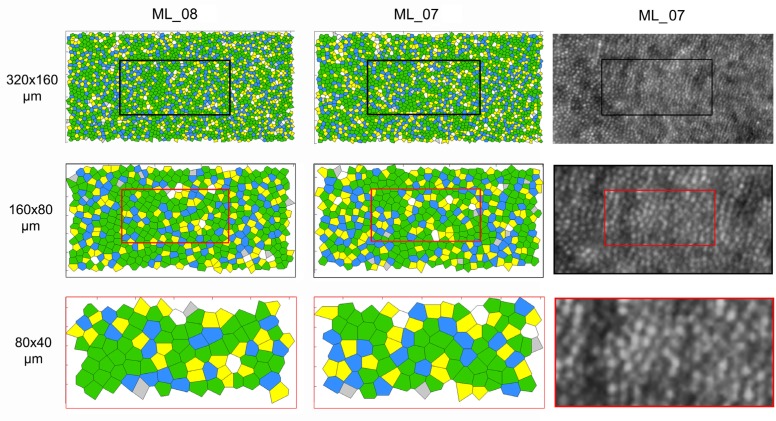
Fig. 6.
Voronoi maps obtained from cone coordinates estimated within the three sampling horizontal window conditions at the temporal fixation location in two subjects (ML_08 and ML_07). Across the horizontal oriented sampling window, the percentage of 6n arrangement tended to increase with decreasing area. In these cases, it ranged from 49.7% and 49.8% to 53.3% and 46.6% respectively. In subject ML_07, the percentage of each of the preferred cone packing arrangements showed differences ≤2.3% between the three sampling window conditions. The images of the cone mosaic at the same retinal location are shown for subject ML_07.

