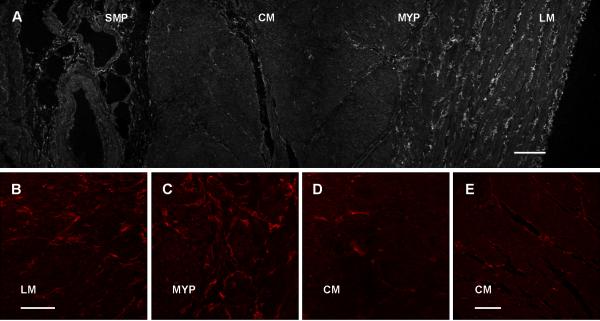
Figure 1.
PDGFRα immunoreactivity shown as a low power tiled image across the thickness (A) of the human gastric body (Scale = 200 μm). Higher power images are shown for the longitudinal muscle (B), myenteric plexus region (C), circular muscle (D) {Scale = 100 μm}. Panel E shows circular muscle at the same orientation and magnification as longitudinal muscle in panel A (E) {Scale=200 μm}. SMP=submucosal plexus, CM=circular muscle, MYP=myenteric plexus, LM=longitudinal muscle.

